Services Plugins FAQs

Air Chart Plugin - Problem with Real Data and more than 3 series

Hello guys,

thx for a great work on Air Chart plugin! I use the paid version of it and really love it! :blush: However, today I noticed a problem that hinders me in the further development of my application: if I want to display more than 3 series in a bar chart, I use “Append new series” action within “Chart is drawn” workflow as suggested by the documentation. And it works, but unfortunately, thereby, the chart loses it real-time property. So, if a user creates a new point in the database that should be displayed on the chart, it is not visible until the user reloads the page. It is quite strange behavior because usually Air Chart charts are real-time and react immediately to the changes in the database.

Is it a bug? Or is there any workaround?

For my app I really need a bar chart with 5 series that are real-time.

Best and thx in advance

Paul

Hello @paul.springer2403,

Thank you for reaching out to us.

I’ve conducted some tests and was able to replicate the issue you described. Interestingly, this seems to be specific to the Bar Chart, other charts are working fine with “live changes” after new series are appended. I’ve forwarded all the necessary information to our development team for further investigation and to find a resolution.

We sincerely apologize for any inconvenience this may have caused you. Could you also inform us which plugin you are using, Lite or Pro? This will help us prioritize the implementation of the fix accordingly.

Thank you once again for bringing this matter to our attention. We look forward to your response. :pray:

Best regards,
Stefan

Hello @Stephan,
Thank you very much for a quick reply and your help! I’m using the Pro version.
Best
Paul

1 Like

Hello @paul.springer2403,

Thank you for your valuable feedback, we truly appreciate it. :hugs:

Today, we’ve released of a new plugin version that introduces several enhancements, that include the option to render each line as dotted for some Charts, and the addition of decimal numbers when the Y-axis has smaller values.

Your request regarding live changing the chart values is presently under review by our development team, and I will inform you as soon as we have any updates.

If you have any further questions or suggestions in the meantime, please don’t hesitate to reach out. :pray:

Wishing you a wonderful day ahead!

Best regards,
Stefan

Hello @Stephan,

thx for the update! I hope the bug with non-real-time values in bar charts with more than 3 series can be also resolved soon since I need it to work properly for our next release in 2-3 weeks.

Best and a great day

Paul

1 Like

Hello @paul.springer2403

Thank you for your message.

Rest assured, we’re working on the resolution of the mentioned inquiry, and anticipate having it fixed well before the 2-3 week timeframe. We’re committed to ensuring that the update seamlessly addresses various use cases.

We appreciate your keen observation and collaboration. :pray:

Best regards,
Stefan

1 Like

Thank you very much😊

1 Like

Hello @paul.springer2403,

I hope this message finds you well.

After a thorough review of the problem you’ve encountered with real-time data updates when appending new series, we’ve identified that this problem is due to inherent limitations from both the Bubble platform and the underlying library used in our plugin.

Specifically, the library currently lacks support for selectively removing or updating individual series within the chart. Additionally, Bubble’s framework restricts dynamic updates to the chart without a complete refresh.

Given these constraints, our plugin’s current implementation adheres to the functionalities that are presently available. We sincerely apologize for any inconvenience this may cause you. Please be assured that we are continuously exploring ways to enhance our plugins, and we will promptly inform you of any relevant updates. :pray:

Should you have any further questions or require assistance, please do not hesitate to reach out. Wishing you a great week ahead!

Best regards,
Stefan

Hi @Stephan

I’m very sad to read it. Unfortunately, it would make the plugin unusable for me. Isn’t it possible to simply allow 5 or 6 series to define in the corresponding bar chart element?

Currently it is only 3 and for my application I need 5 stacked series.

Best
Paul

1 Like

E.g. I noticed that Chat JS Plugin allows definition of up to 6 series in the chart element.

1 Like

Hello @paul.springer2403,

Thank you for your message.

I have reviewed your request and forwarded it to our development team to explore potential solutions. I will update you with any new information as soon as it becomes available. :pray:

With the current plugin, it is also possible to add as many lines as you want using the “Append new series” action. However, I understand that you need the ability to dynamically change the values and have them displayed immediately.

If you have any other questions or need further assistance in the meantime, please do not hesitate to reach out.

Thank you once again for your cooperation and patience.

Best regards,
Stefan

Thank you very much @Stephan for a quick reply!

1 Like

Hello @paul.springer2403,

You’re very welcome! :blush:

Please feel free to reach out if you have questions about any other Zeroqode products while we wait for updates on this matter. :pray:

Wishing you a great day ahead!

Best regards,
Stefan

Hello @paul.springer2403,

I hope this message finds you well.

Thank you for your patience while our development team evaluated the feasibility of expanding the series capacity for the bar chart element. For the time being, it was decided to add this suggestion to our list of potential future enhancements, as implementing it would require significant changes to the plugin. We will keep you updated if such feature will be implemented.

I apologize for any inconvenience this may cause, if you have any other questions regarding our plugins, please don’t hesitate to reach out. :pray:

Wishing you a wonderful weekend ahead.

Best regards,
Stefan

thank you very much @Stephan!

1 Like

Hello,

I’ve purchased the Pro version and I’m facing a similar issue that @paul.springer2403 described.

In my case I have a “MixedChart(Line/Area/Bar)” displaying multiple series filtered by a date range input. I can´t figure out a solution to have more than 3 series synced with a dynamic list, I’m quite disappointed at this point since it may not make sense to use this plugin at all on my project, since it’s a core feature.

@paul.springer2403, did you end up finding an alternative?

Best regards,
Nuno Veloso

1 Like

Hello @nunomiguelveloso ,

Thanks for reaching out to us.

Have you tried using the “Append new series MixedChart” action to add more series to the chart? This action allows you to include a significantly larger number of series to the chart.

Please let me know how it works for you. If not, could you share more details about your specific use case? Any screenshots, screencasts, or information on how you’ve set up the element, the workflow, and what you see in preview mode would be greatly appreciated. This will help us better understand your needs and investigate further.

Thanks, and looking forward to your response.

Best regards,
Support Team
Browse all Zeroqode Plugins for Bubble
Banner_Last3

Hi @Stephan,

Thanks for the reply.

Yes, I did try that. The problem is that the series defined through the “Append new series MixedChart” action don’t get updated when the list changes. An easy workaround would be appending a new series every time the data changes, but in that case, we would need a “Remove series MixedChart” to delete the old one. Or, a different solution, an "Update series MixedChart” action.

I’ll prepare the screenshots for you, thanks.

1 Like

Hi @Stephan,

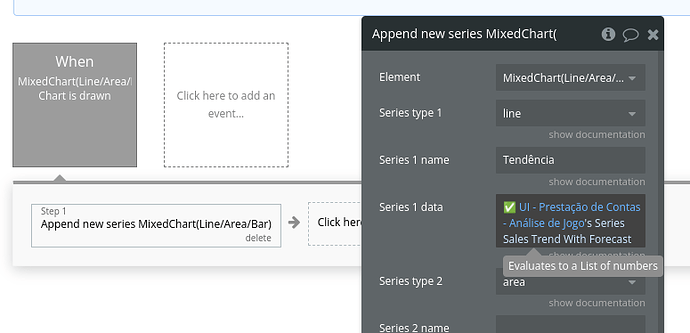
Thanks for your prompt response earlier. As promised, I’m sharing a screenshot of my workflow setup for appending the extra series. You can see in the attached image that I’m using the “Append new series MixedChart” action to add a series with dynamic data (“UI - Prestação de Contas…”). This works fine initially.

However, the issue arises when the underlying data list gets updated. The appended series does not refresh automatically to reflect the changes in the data source. This is a major problem for my use case, as the chart needs to be dynamically responsive to changes in real-time.

A possible workaround could be to re-append the series every time the data changes, but that requires a complementary “Remove series” or an “Update series” action to clear the old series first, which is currently missing.

Is there a way to address this limitation? If not, could such actions be added to the plugin in a future update?

Looking forward to your thoughts and any suggestions.

Best regards,
Nuno

1 Like

Hello @nunomiguelveloso,

Thank you for your message, and please accept our apologies for the delayed reply over the weekend.

Regarding your concern, indeed implementing multiple charts on the MixedChart element and having the data automatically update from the database is, unfortunately, not currently possible.

However, if you’d like the option to specify a particular number of series directly in the element, you may consider sponsoring the development of this feature. To begin the sponsorship review process, please complete our Sponsoring Plugin Features Form: Airtable

After receiving your form, we’ll review it and provide an estimate of the required development hours and associated costs.

We look forward to working with you and better serving your needs.

Best regards,
Support Team
Browse all Zeroqode Plugins for Bubble
Banner_Last3