Hi everyone 
Exciting news!
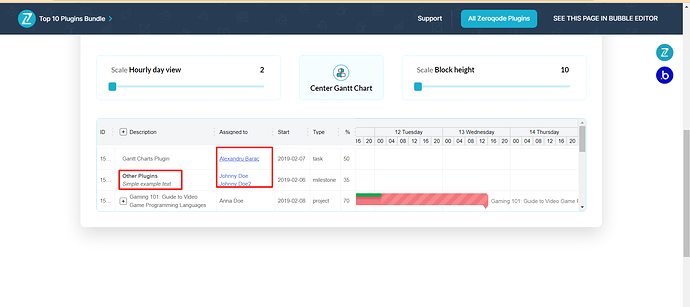
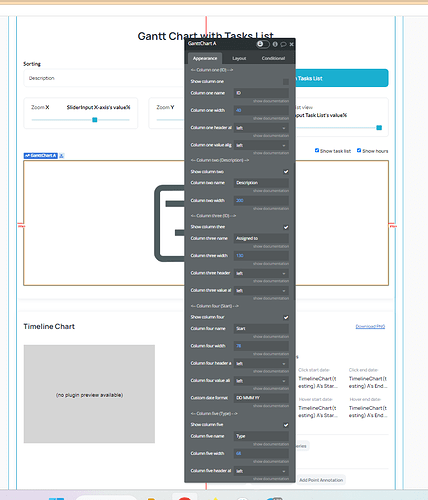
Our Gantt Chart plugin has received a major update, now featuring two additional useful charts: Funnel (1D and 2D) and Timeline.
With this enhanced plugin, you can effortlessly create dynamic Gantt charts and timelines, enabling efficient planning and tracking of project tasks and milestones. Plus, the new funnel chart feature adds a visually engaging way to analyze sales pipelines and conversion rates, making it an invaluable tool for data presentation and insights. Take your project management and data visualization to the next level with our improved plugin!
To try it out, please visit the plugin demo page:
Please feel free to reach our Support team in case you have any questions. We will be glad to help. 
Cheers! 

