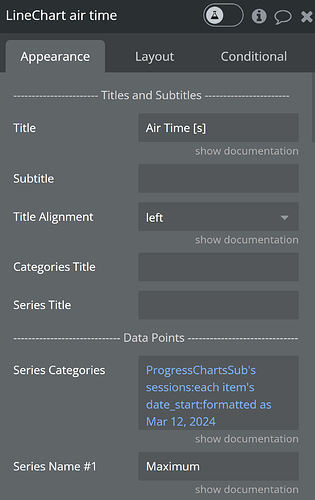
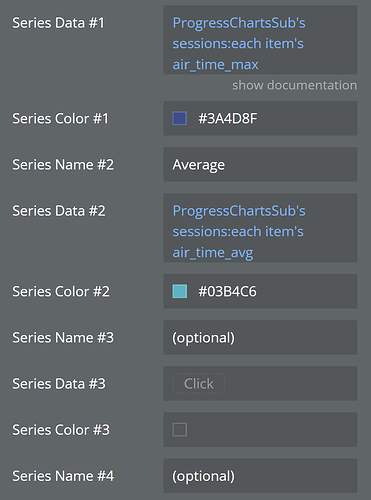
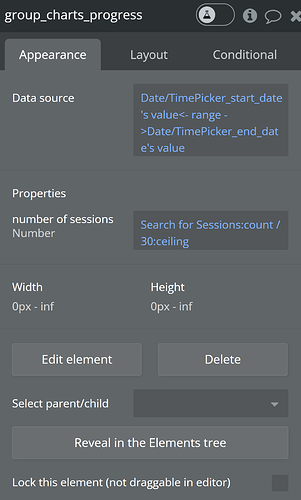
Hi all, I wanted to report a bug with the rendering of the graphs in the Air Line Chart Lite Bubble Plugin.
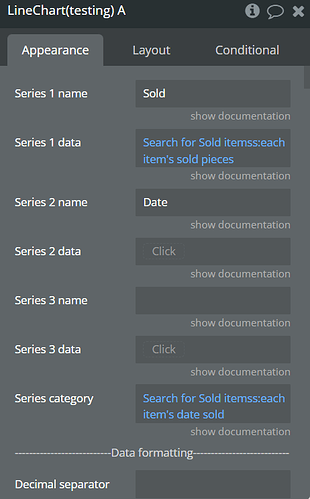
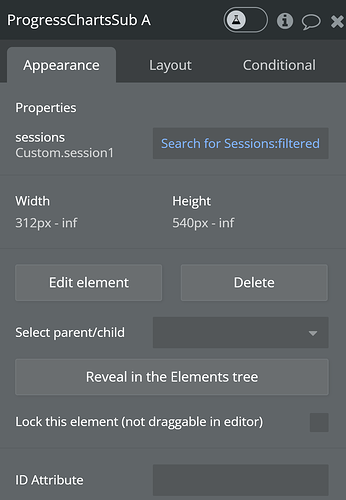
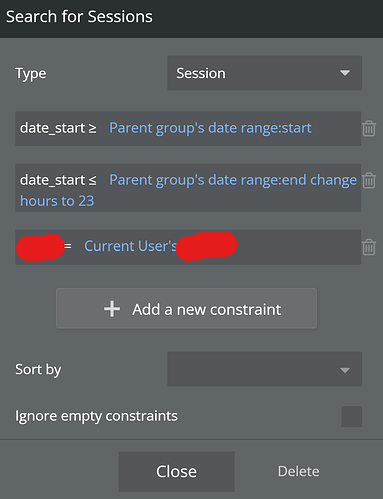
In a Bubble web app, I am plotting data that I look up based on the input of the user in a drop down.
On mobile only, once the graph has been changed at least once through the drop down, any time the user scrolls, the graph flips through all the previous plots before stopping at the one selected.
If we take an example where the initial values being visualized are Data_1 and the user has selected the following:
Data_3
Data_4
When the user now selects Data_2, the graph will plot very shortly, Data_1, Data_3, Data_4 and then finally Data_1 where it will stop until the user scrolls (then it repeats the process).
I have taken the debugging steps of different approaches of feeding the data to the graph including using a value in the DB as an intermediary between the dropdown and the graphs to exclude a specific interaction with the specific dropdown I am using. The issue seems to be with the rendering of the graph on mobile.
Any help much appreciated!


