Hi @m611,
Thank you for reaching out and providing the detailed context and images.
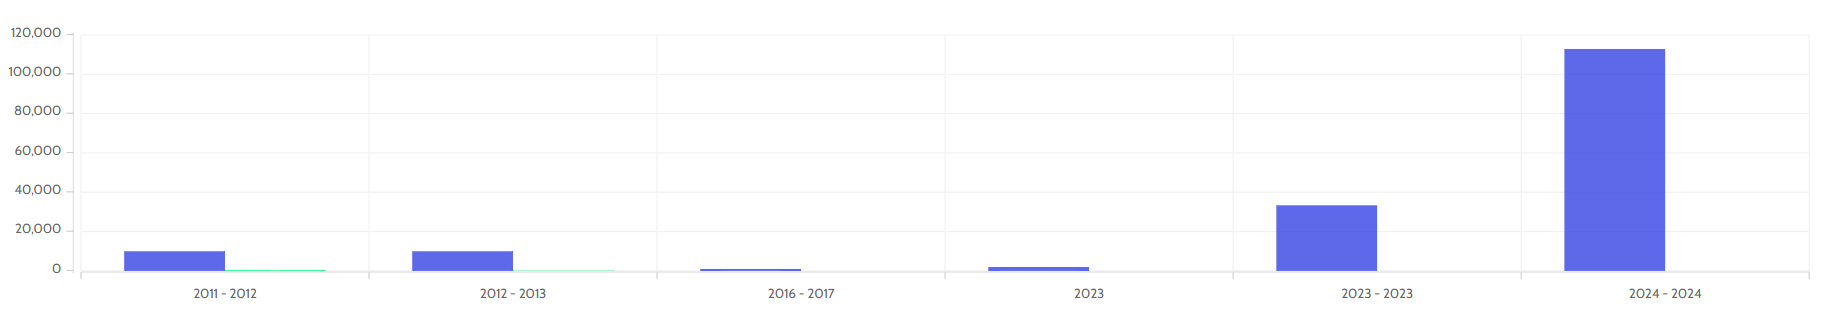
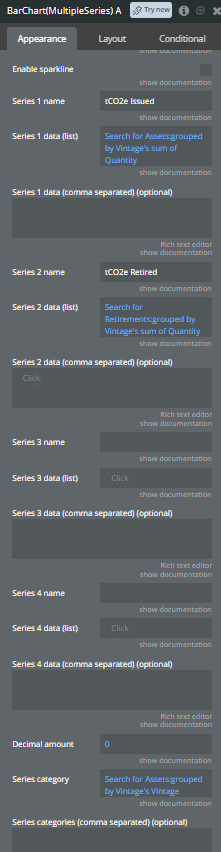
I understand the issue you are facing with the BarChart(MultipleSeries) A element. Based on your description and the configuration screenshots, the problem occurs because the plugin matches data points strictly by their index position in the lists provided, rather than dynamically matching them by their corresponding categories.
Your Series category field is defined as: Search for Assets:grouped by Vintage's Vintage
This creates a master list of categories based solely on the Assets data. However, your Series 2 data (list) fetches a separate grouped list: Search for Retirements:grouped by Vintage's sum of Quantity
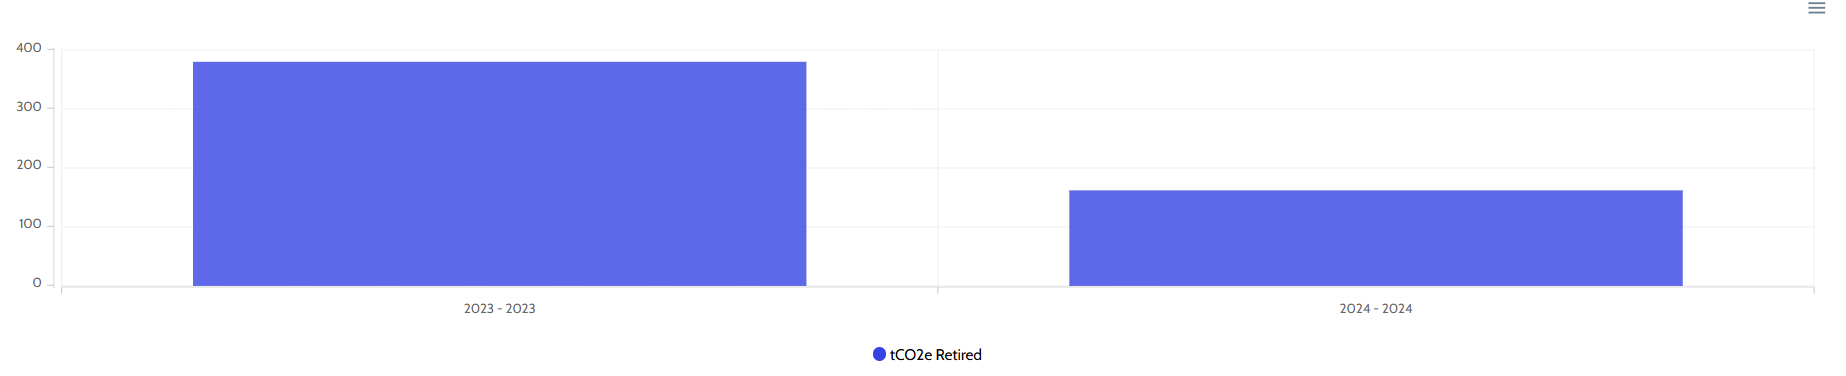
Because the Retirements data has fewer data points and missing years compared to the Assets data (as illustrated by the single-series view), Bubble returns a shorter list of numbers.
The chart plugin then aligns the first number of the Series 2 list with the first category from the Series 1 list, which shifts your “2023 - 2023” data under the “2011 - 2012” category.
To fix this misalignment, you need to ensure that both data series have the exact same number of items and correspond precisely to the same category positions.
Solution Steps
To achieve index alignment, you must change how your data series populate their values by mapping them directly to the master list of categories.
-
Keep the Master Category List: Keep your Series category field exactly as it is:
Search for Assets:grouped by Vintage's Vintage
-
Reconfigure Series 1 Data: Change Series 1 data (list) to map directly from the grouped categories to guarantee perfect alignment:
Search for Assets:grouped by Vintage's sum of Quantity (If this already perfectly matches the category sorting and length, you can keep it, but mapping from the master categories list is safest).
-
Reconfigure Series 2 Data: Instead of running a separate independent search that groups by its own attributes, use the master categories or the Assets search to look up the corresponding Retirements values for each specific year. Change Series 2 data (list) to a dynamic expression that iterates through the master categories:
Search for Assets:grouped by Vintage's Each item's Vintage:format as text
However, a cleaner Bubble-native approach without advanced text formatting involves modifying the expression to map the values. You can format the master categories list or use the :format as text operator to build a comma-separated string, or construct a matching list of numbers.
Alternatively, the most reliable setup for multi-series charts when datasets don’t match perfectly is to use a single unified data source or a master list of Years (Vintages). For example:
-
Series category:
Search for Vintages's Title (a master table of all possible years).
-
Series 1 data (list):
Search for Vintages:each item's sum of Assets Quantity (using a backend constraint or relationship).
-
Series 2 data (list):
Search for Vintages:each item's sum of Retirements Quantity.
If a master table of Vintages does not exist, you can use the :format as text option on your Series category list to perform a nested search for each item’s Retirement quantity, outputting a comma-separated list of numbers, and placing that into the Series 2 data (comma separated) (optional) field instead. In that nested search, ensure you add a constraint where Vintage = This item and default the value to 0 if no matching retirement exists for that year.
Best regards,
Support Team
Browse all Zeroqode Plugins for bubble