
This plugin provides 20 customizable charts that help you to create beautiful and interactive visualizations for the app. The plugin elements are optimized and developed with many useful options. Each element has a variety of actions and events that allows the creation of user-friendly functionality. Plugin provides customization for the Background grid color, Zoom selection color/opacity/stroke, Summed data tables on the stacked chart, 2nd Y-Axis color/border/title. Line color/opacity/curveness, label size/color/position and many others.
Support Charts:
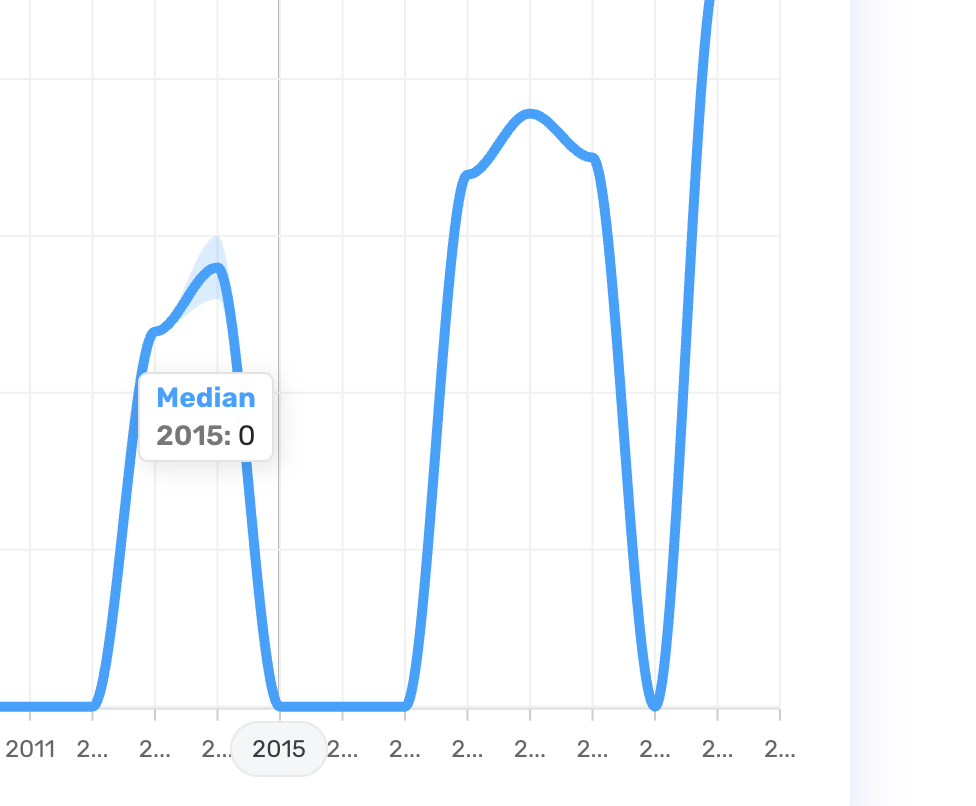
Line Chart
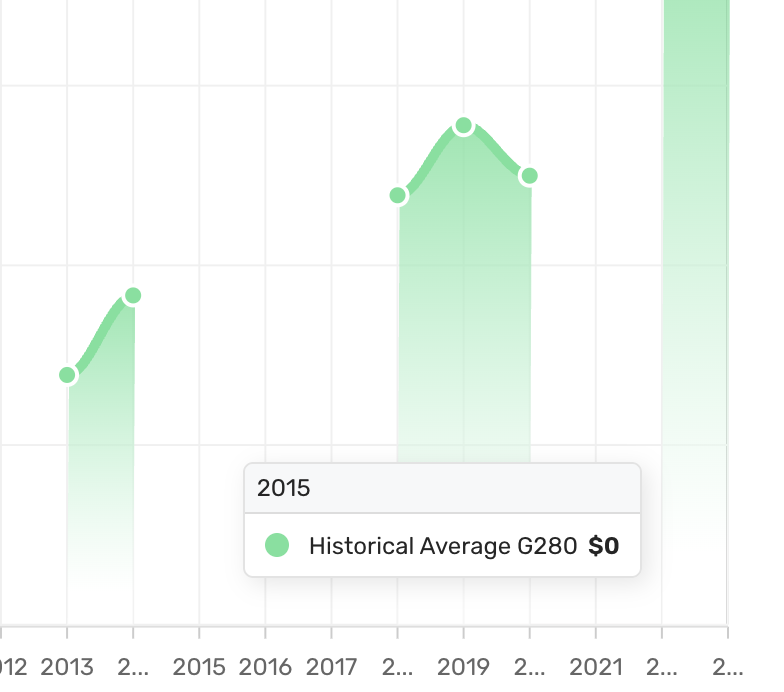
Area Chart
Bar Chart
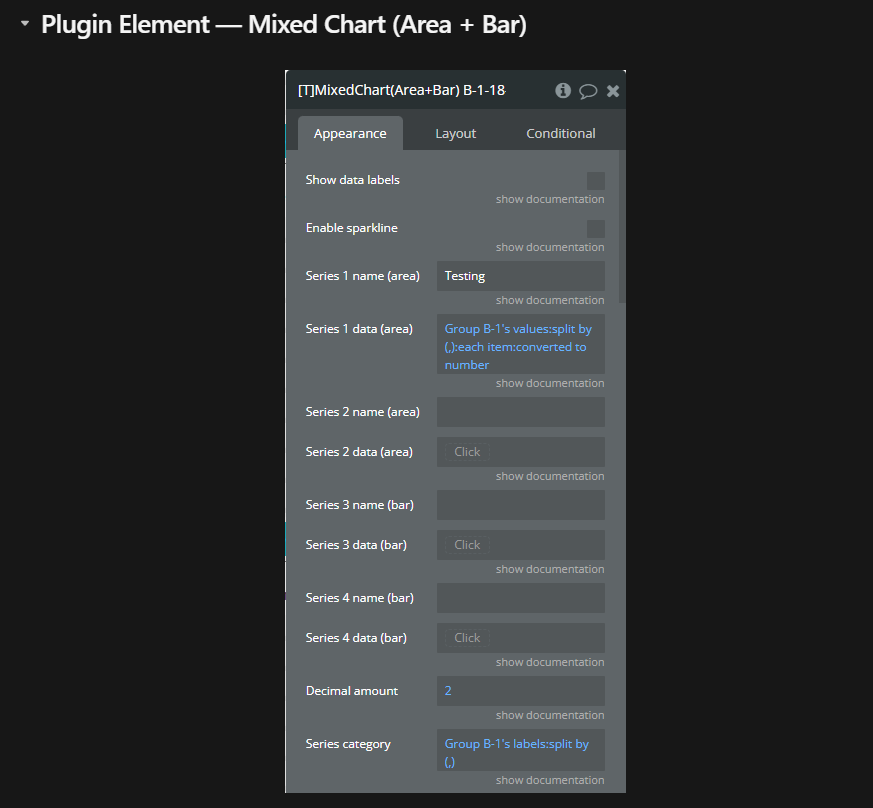
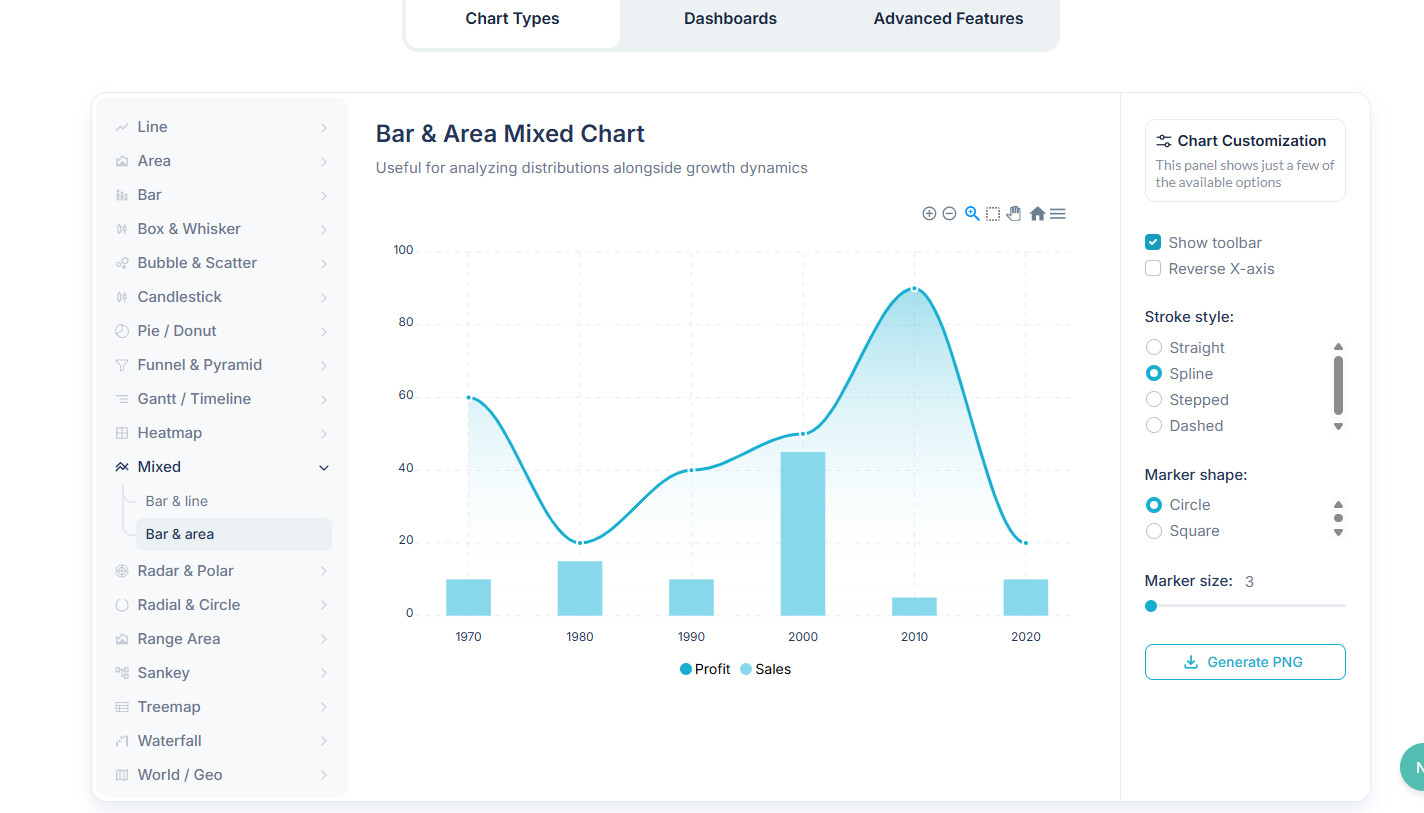
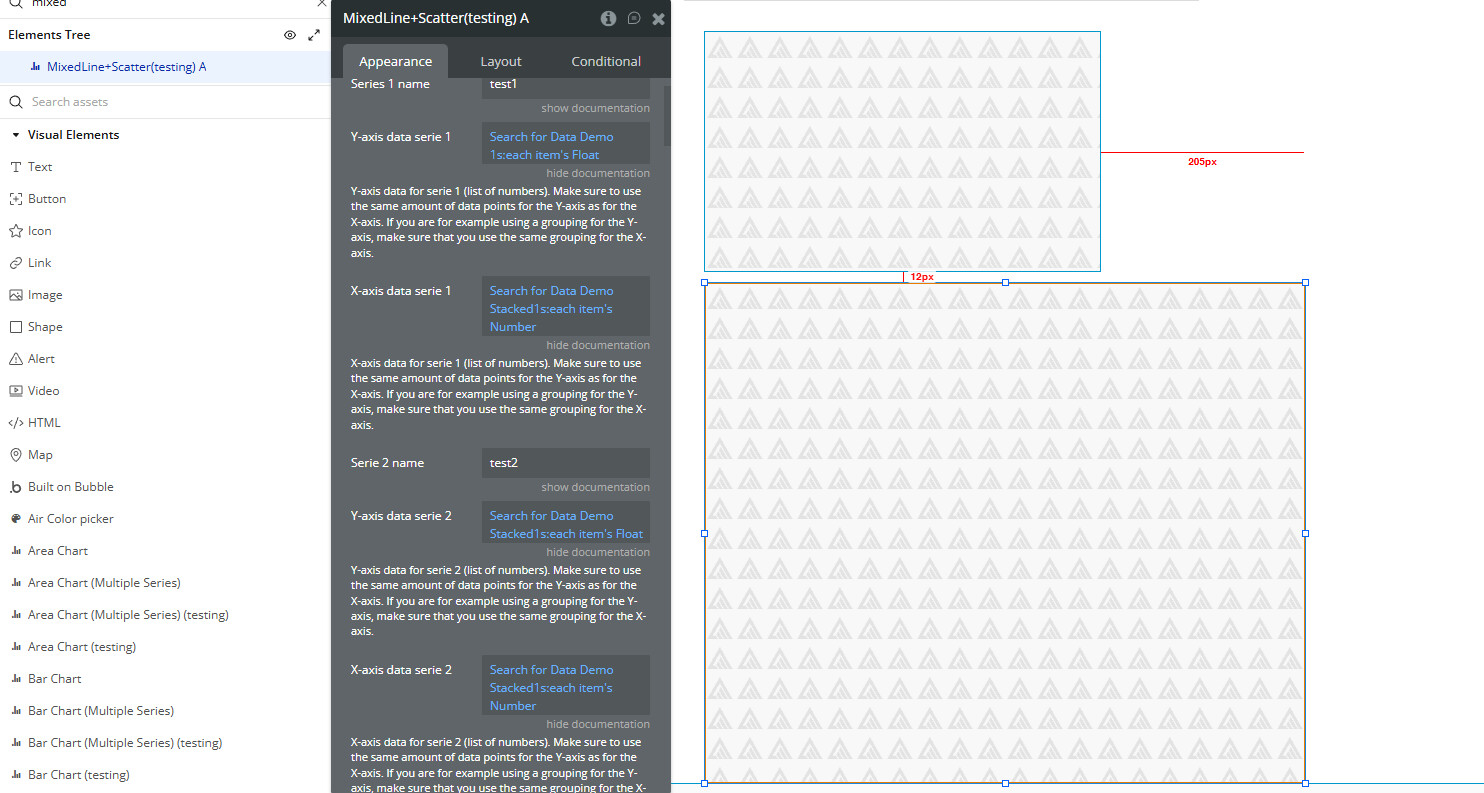
Mixed Chart (Line/Area/Bar)
Boxplot Chart
Candlestick Chart
Timeline Chart
Range Area Chart
Heatmap Chart
Treemap Chart
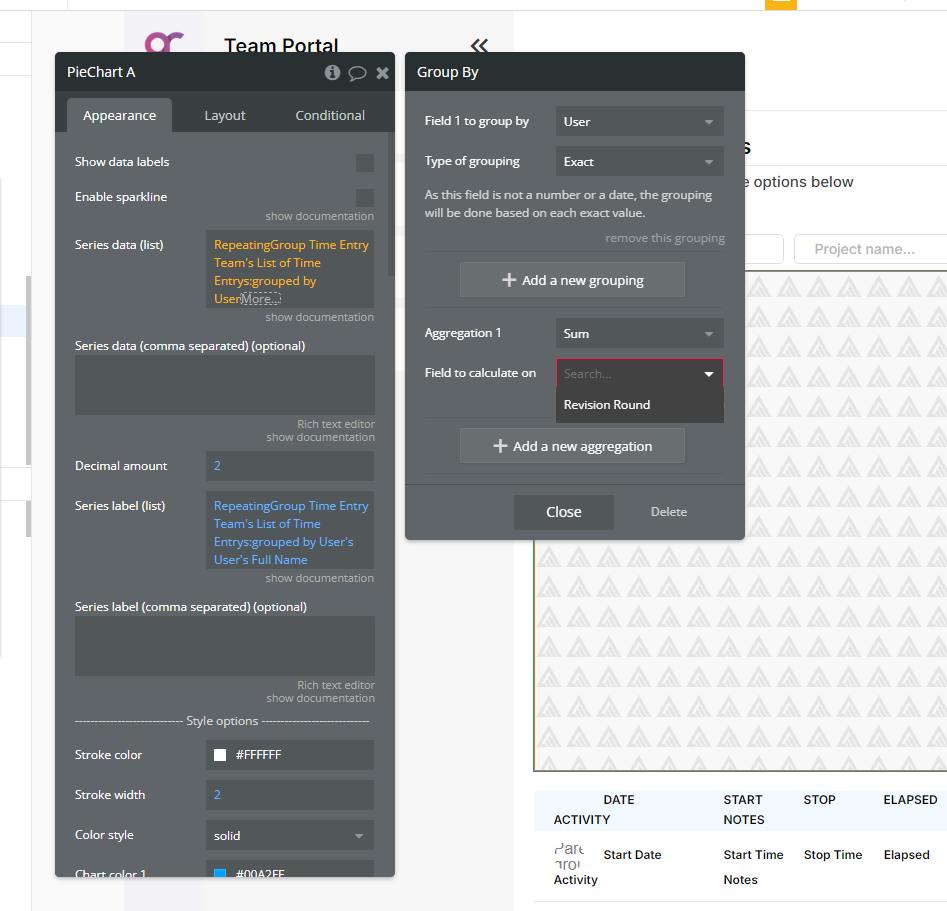
Pie/Donut Chart
Radar Chart
Radial Chart
Bubble Chart
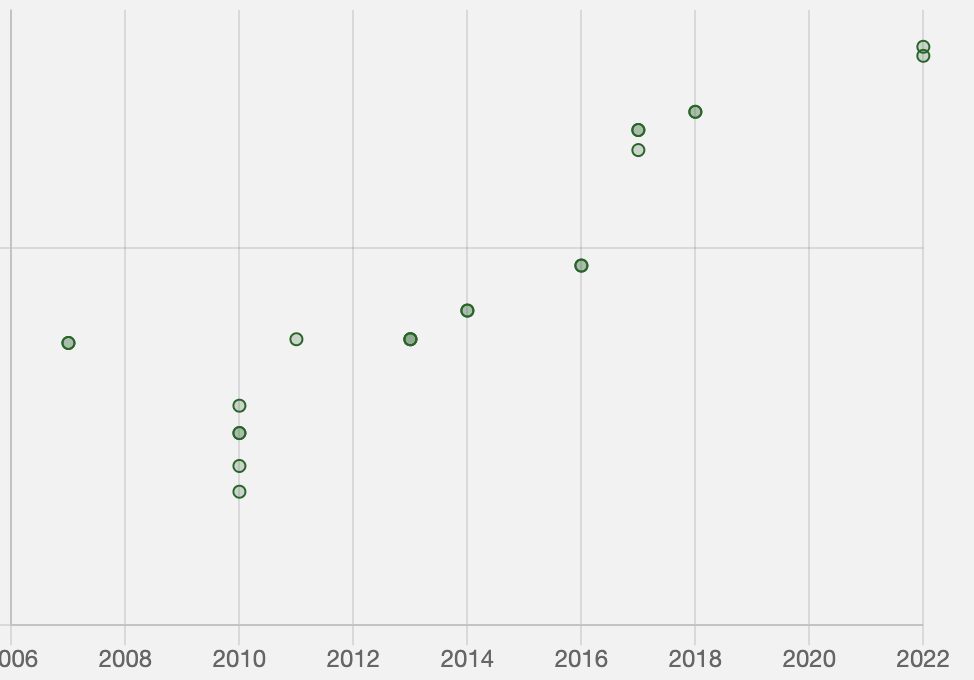
Scutter Chart
Polar Chart
Waterfall Chart
Funnel 1D Chart
Funnel 2D Chart
Sankey Chart
 We sincerely aim to develop the plugin to be clear and optimized for your convenience. We are currently in the process of preparing the documentation, which will be made available soon. Should you require any assistance or have any questions, please do not hesitate to contact us. We are more than happy to help you.
Live demo: https://zeroqode-demo-28.bubbleapps.io/apexcharts
Docs in progress: Docs for Apex Charts
SUPERCHARGE YOUR APP WITH ZEROQODE PLUGINS
No-Code App Plugins for Bubble | Zeroqode
Ilinca-Andreea Ceban
Executive assistant @ Zeroqode

 165+ Bubble Templates
 35+ Bubble Courses
 300+ Bubble Plugins
 Convert Bubble app to iOS & Android
 No-code Development Services


 New Name: Air Chart Pro: 182 Premium Charts
 Updated Links:
 Love charts? Also check out our: