I’ve just purchased the Gantt chart plugin, however when I click on the documentation link, no documentation is shown (it looks as if it is a broken link).
Are you able to resolve please as I have gone as far as I can without the documentation?
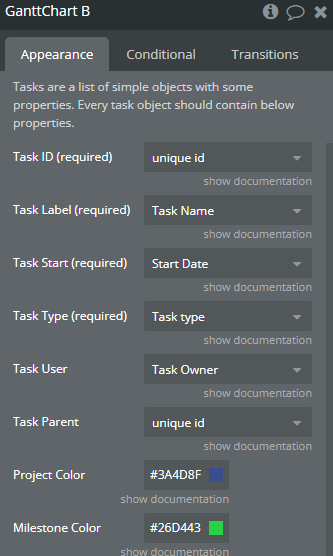
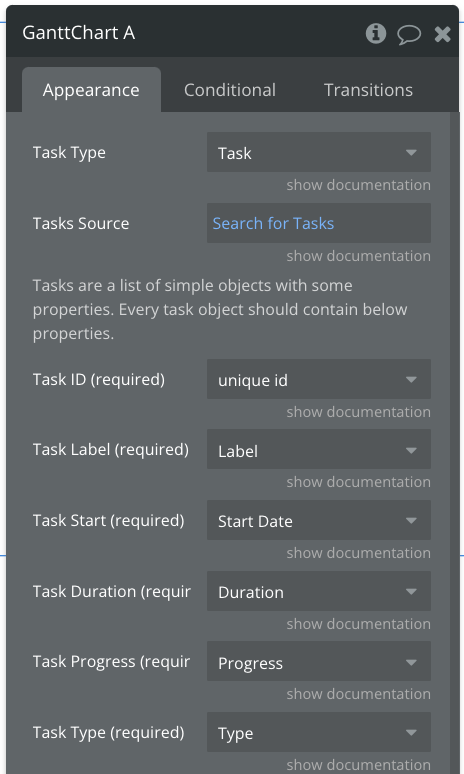
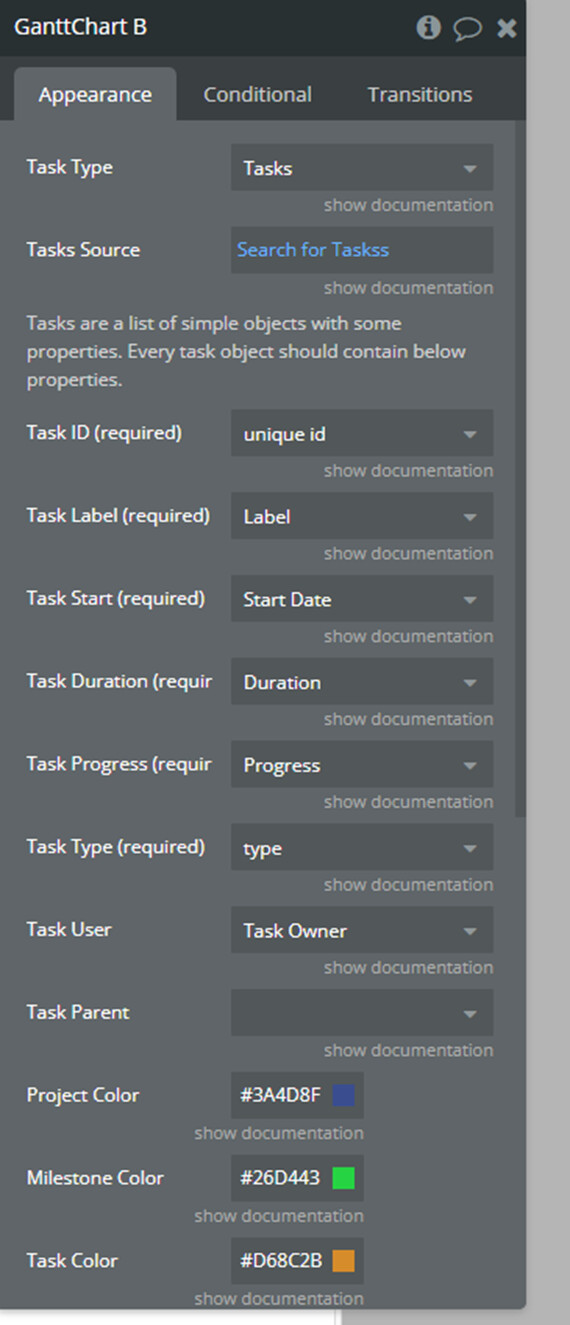
Looking at the documentation I don’t see a number of the fields in the set up panel that are noted as ‘required’ in the documentation - such as Duration and Progress. Please see screen grab, below. As I cant set these, i can’t get the Gantt chart to show - are you able to advise please?
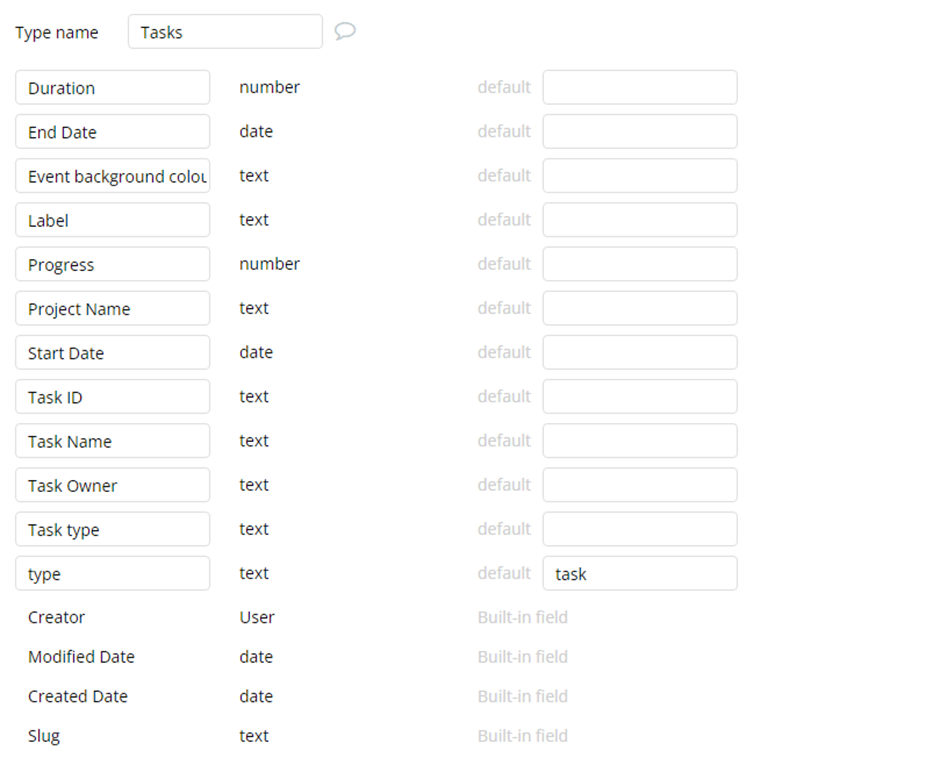
I just added in all the optional fields into the database also (parent, collapsed, dependent) based on an older chat thread, but this also did not make it work?
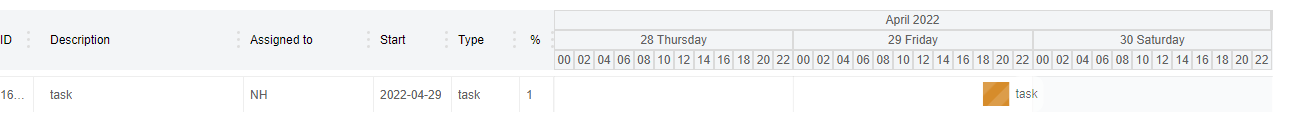
OK, I set progress of the one task in my database from 0 to 1 and then the chart appears. This is good news, but shouldn’t the tasks show even if the progress is 0? i.e. at the start of a project?
Last query!! Is there anyway to set the default view to say, 20 (effectively a day view). The Input slider changes the x axis as required, but this in only when the slider is clicked, so the default value in the input slider (say set to 20) does show this on the input slide but obviously doesn’t impact the gantt chart itself. I can’t see a way to default the start view for the x axis?
We’ve checked the Demo page and found some issues with its functionality. I would like to let you know that our developers are investigating the issue, and as soon as I have any news I’ll get back to you.
In case you have any other questions, or issues please let me know.
Great, thanks for the update. Is there anyway to set the default view to say, 20 (effectively a day view). The Input slider changes the x axis as required, but this in only when the slider is clicked, so the default value in the input slider (say set to 20) does show this on the input slide but obviously doesn’t impact the gantt chart itself. I can’t see a way to default the start view for the x axis?
We’ve fixed the issue with the progress bar, it all functions correctly now. Kindly ask you to upgrade your plugin to the latest version (1.8.0) and give it a try.
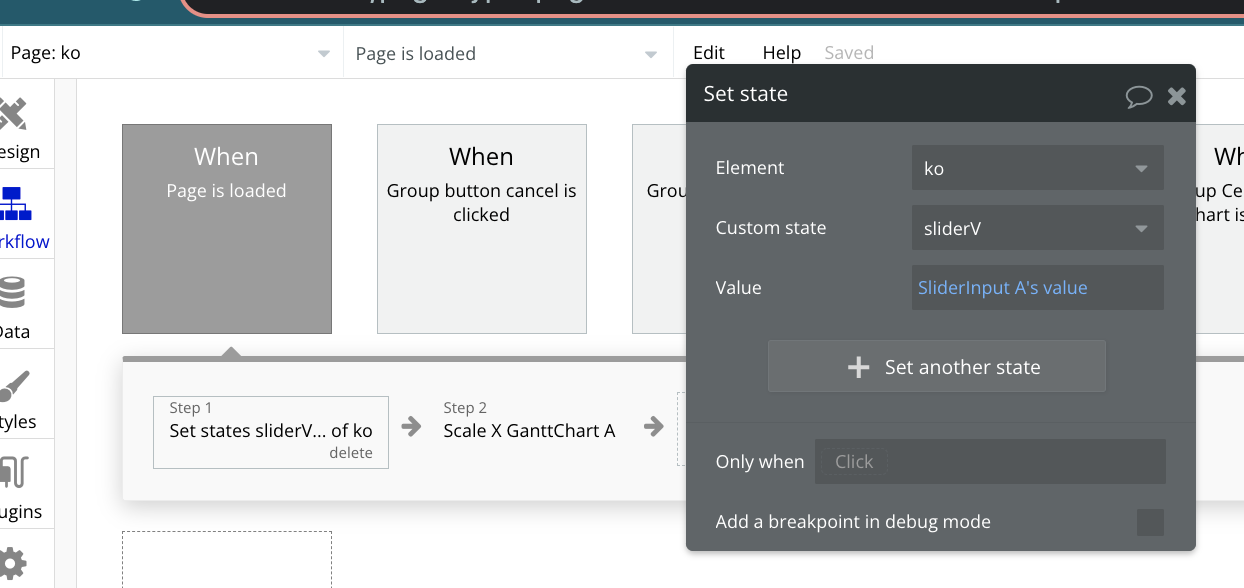
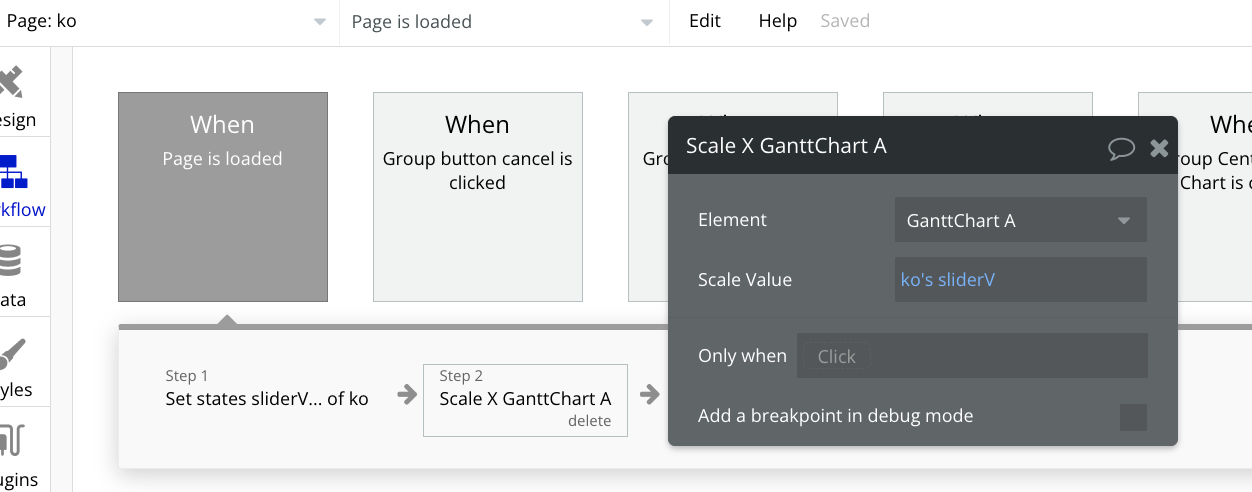
As for your last query, please set an on-page load event and set a state in your workflow. Create a new custom state, the value should be ”input slider’s value” and then, please add the “ scale X ganttchartA” action. Also, please make sure you set the max value (20) for the input slider. For example: