
Just got my hands on this awesome plugin. will like to check if we are able to set labels at the top of each column bars (e.g the value of each column)
Hello, @waikeong
Thanks for using our plugin.
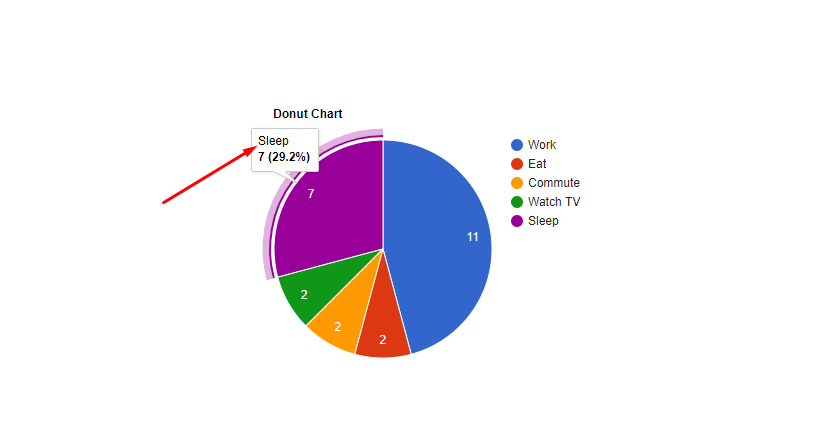
We confirm that you can assign the name for each separate segment or column. It will be visible at hoover:
For the correct setting of this plugin in your application, please analyze the next resources:
-
test the plugin functionality/design by visiting its Live Demo page and find the Workflow of the plugin’s elements;
-
make sure that you have checked the plugin documentation to investigate the structure and main features of the current template set up;
Hope it will help you.
Regards,
Hi @Ecaterina,
Thanks for getting back!
Can these label be shown without hover-over?
Will be great if the data values can be shown on top of each column!
Hello, @waikeong
Thanks for using it.
Unfortunately, but this option is not possible. So, the user can see the information about each column only by hovering it.
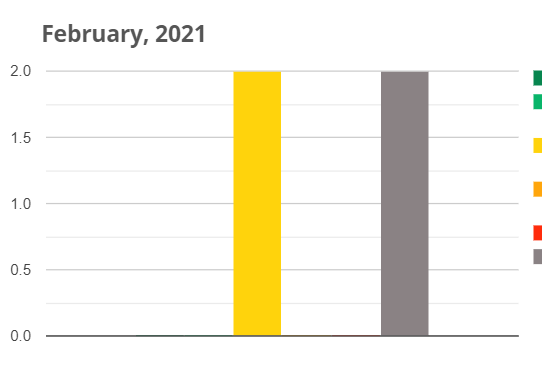
Allow me to recommend you to use the Text files, which can be set on the top of each column:
We’ve taken into consideration the ability to add the name of the Columns in future updates. We need to see how feasible it is to implement.
Thanks for understanding and for your feedback!
Best regards,
Thanks for the workaround, can you provide clearer steps on how to use “Text files”?
P/s: when will this be added in?
Hello, @waikeong
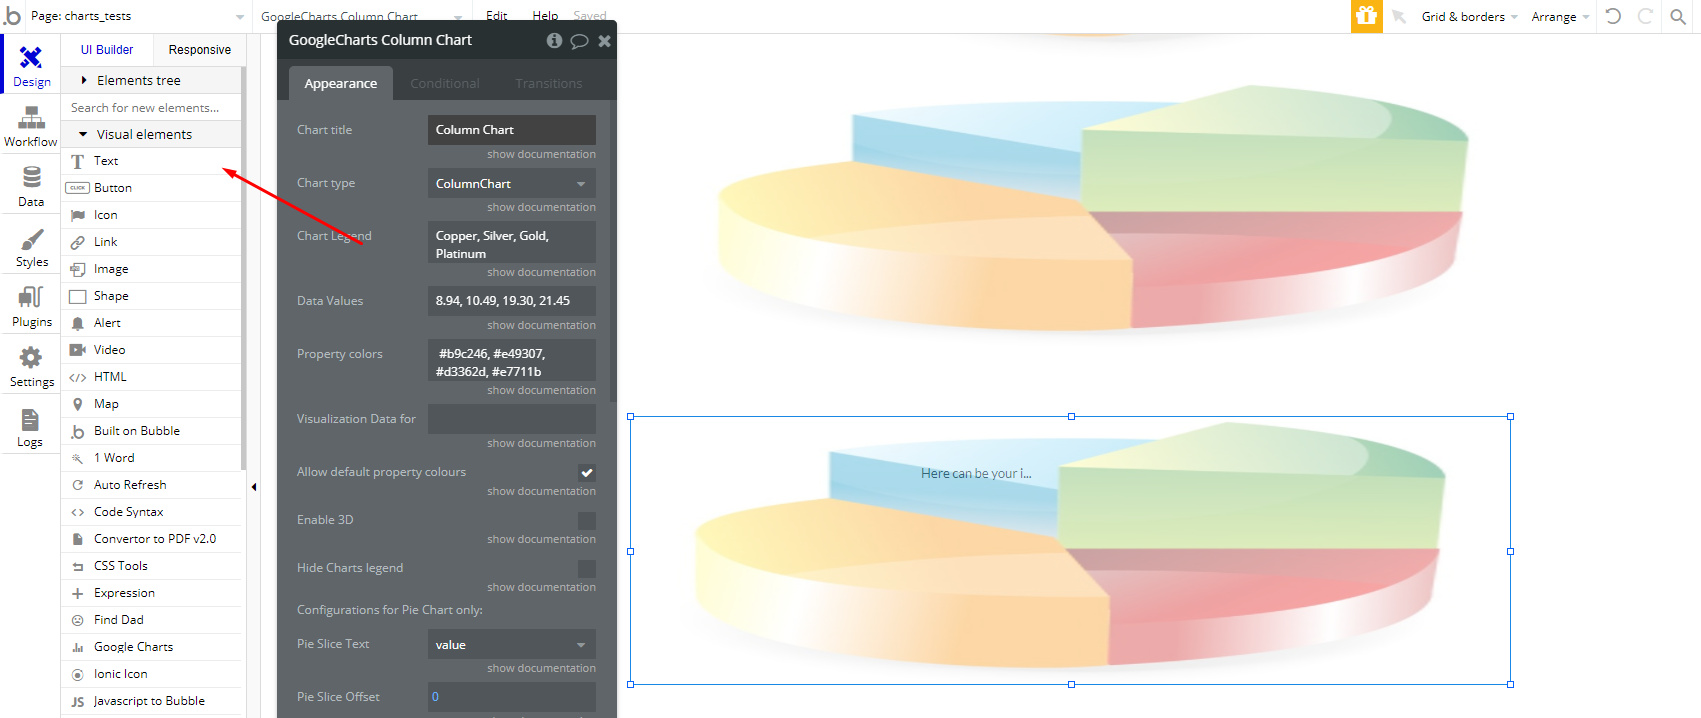
On the Bubble Editor panel, you can find different instruments for use in your application.
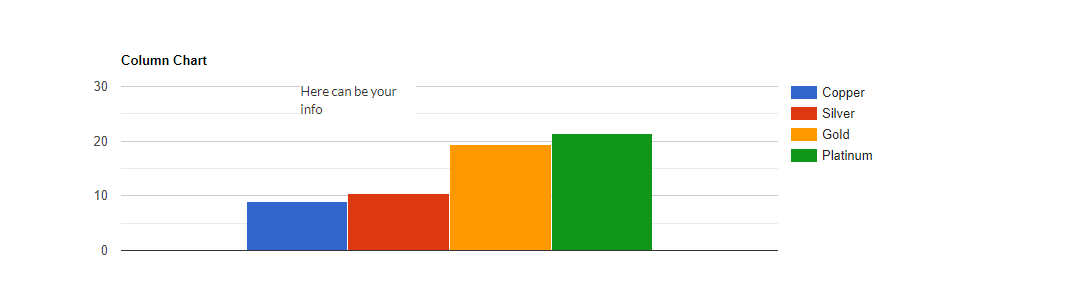
So, we proposed to add a simple Text Field on your chart:
However, this is the only way to add text to each of your columns.
Please note that we can’t provide you some exact terms, because we need to check how feasible it is to implement.
Best regards,
Hi I purchased this plugin to use the column chart but I also need the x and y labels. While you can use a text element for the y label as you suggested, I want to be able to have x labels on each bar/column. This can’t be done with a text element as the columns are dynamic.
The google chart api supports this.
See the documentation about this below. Will really be great to have this.
Hi @starx1957, thank for your message.
I’ve passed it to the developer team for consideration, they will check how feasible would be to add such a feature in future plugin updates. In case any news will appear in this regard, I will let you know asap.
Regards,