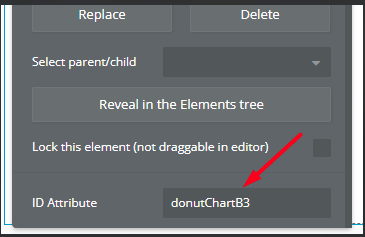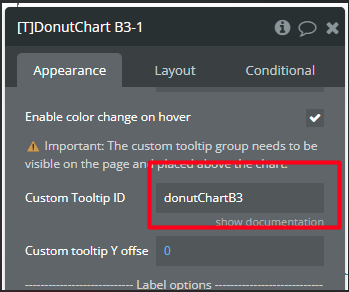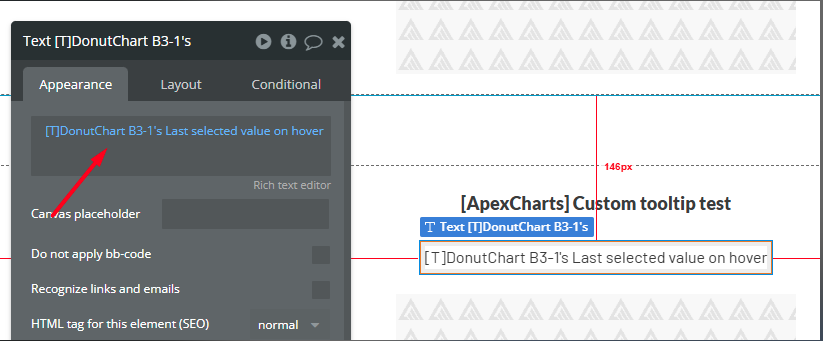
Hi, I noticed that the donut and pie charts titled ‘Product Category’ and ‘Sites Visits’ respectively, the data shows up as discrete numbers instead of as percentages. How can the expression in the Bubble editor be written to show this data as percentages instead?
Furthermore, how might I express the data below as a percentage instead of a discrete number in my app which uses your donut chart?
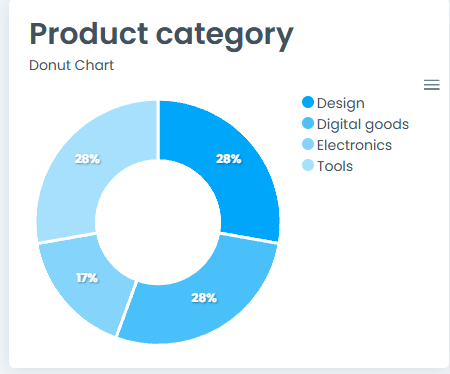
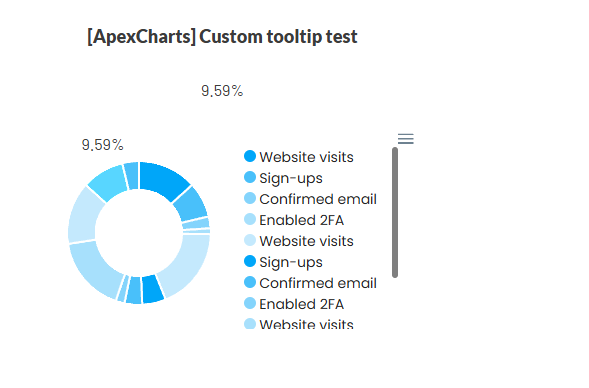
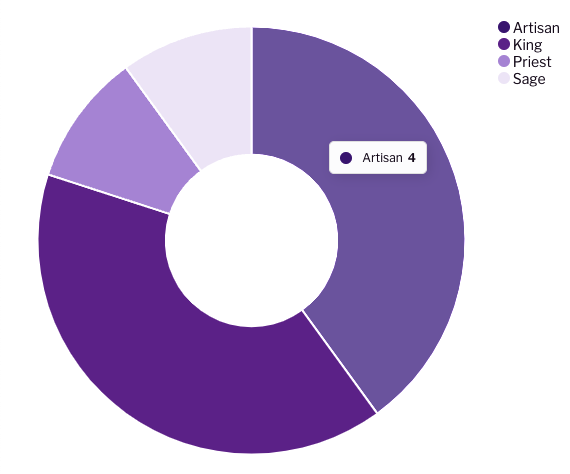
This what the donut chart looks like now:
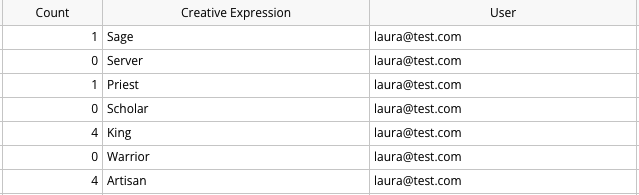
You’ll notice ‘Artisan’ shows up as 4. I would like it to show up as 40%, which is the percentage of the total (10) that 4 represents.
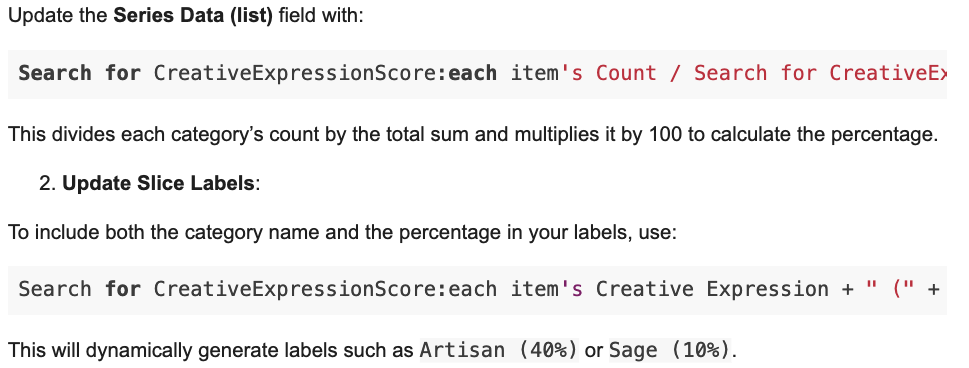
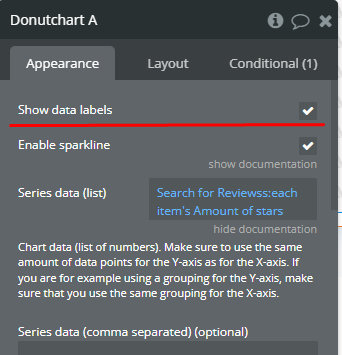
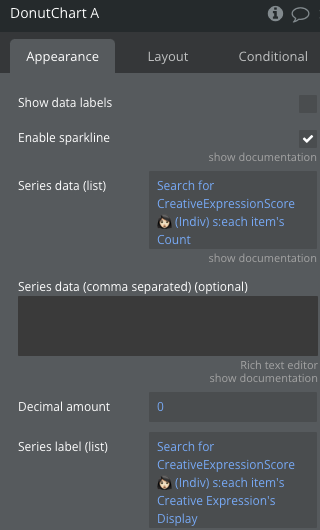
These are the expression I used in my editor:
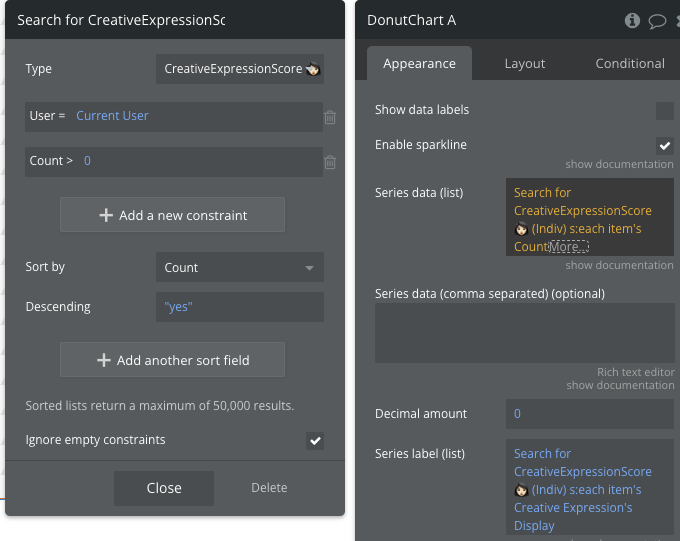
Notice that I added a constraint for counts of 0 as I didn’t want counts with 0’s to show up.
Thank you for your help!
Laura