Services Plugins FAQs

Pie Chart from Three Column in Data

Dear Friends :slight_smile:

I am trying to create a Pie Chart from just three Fields.

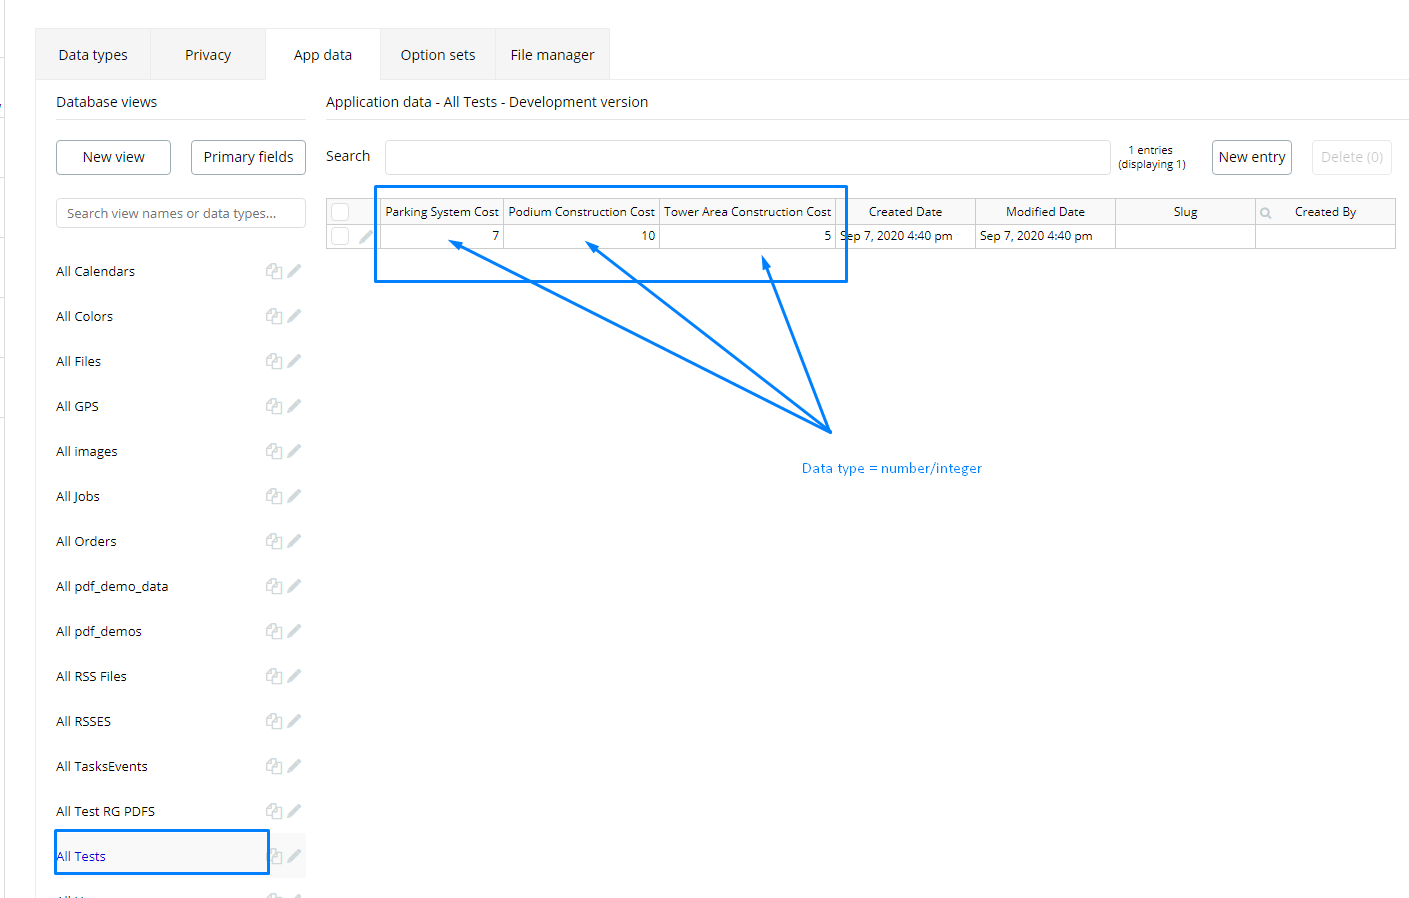
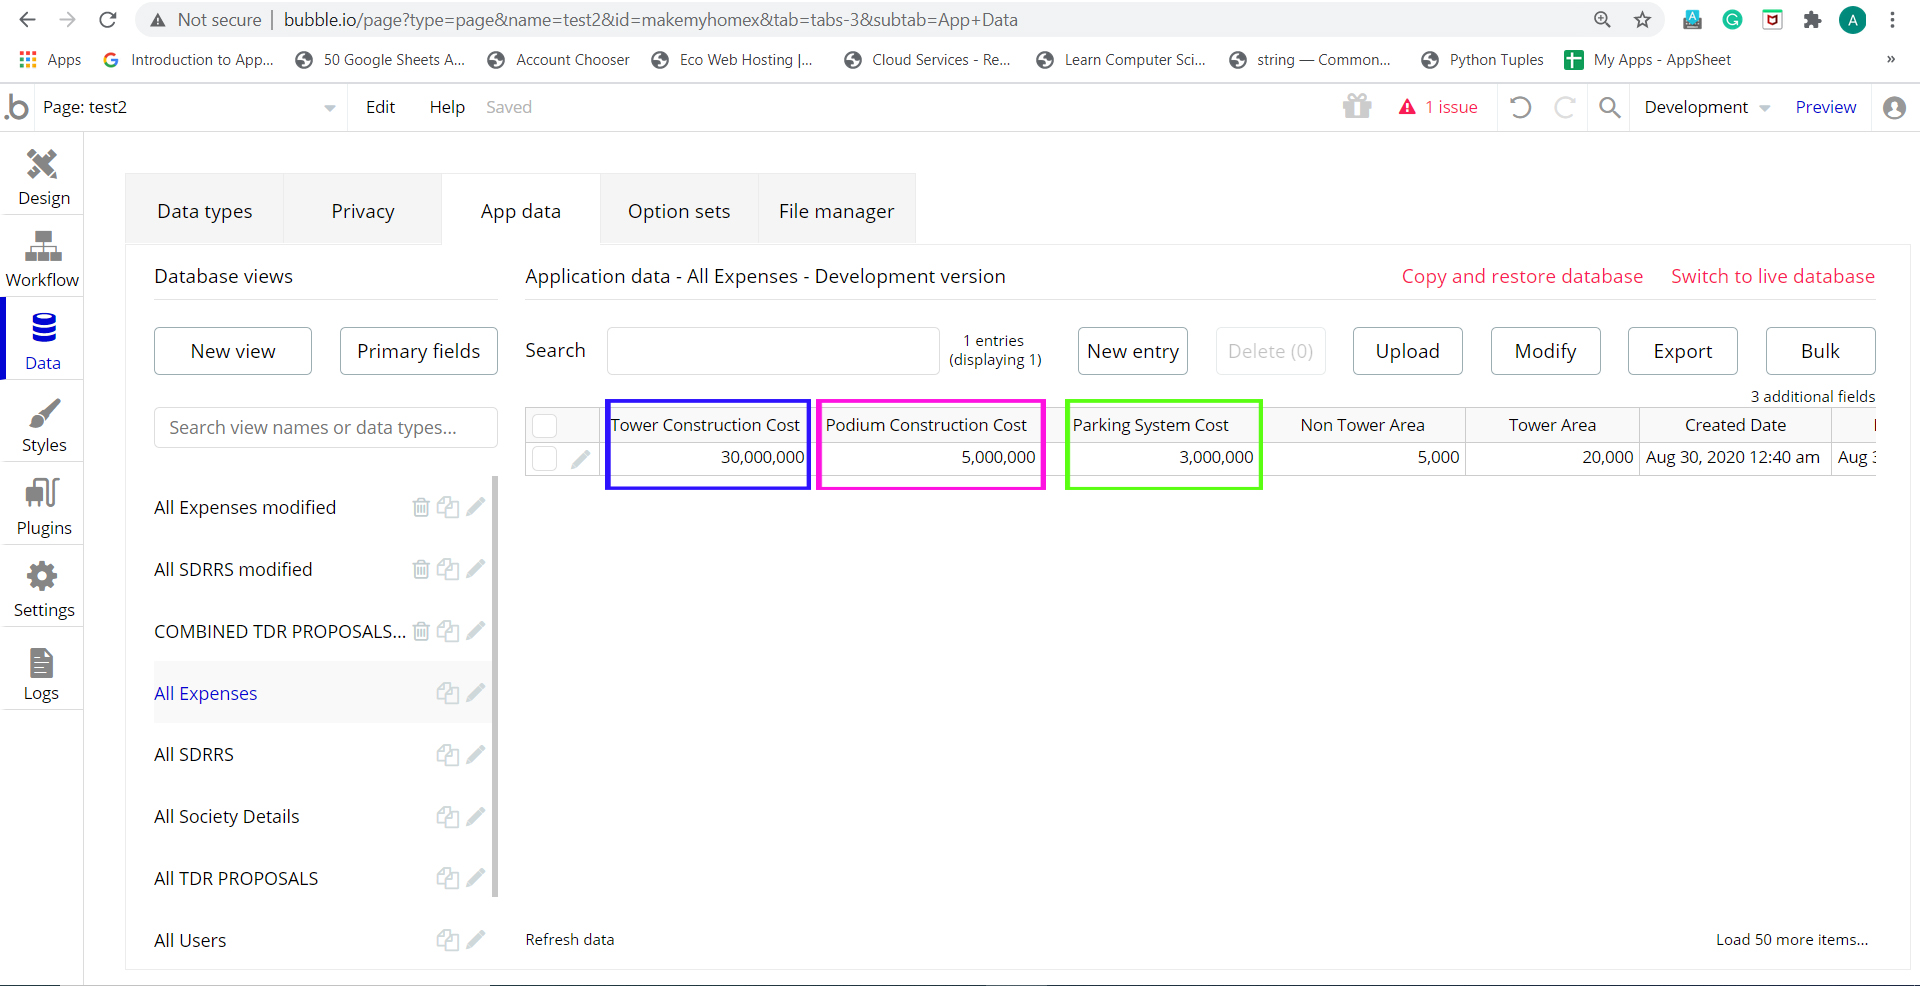
I have Database structured as shown in the following image which has three columns (1) Tower Area Construction Cost (2) Podium Construction Cost (3) Parking System Cost.

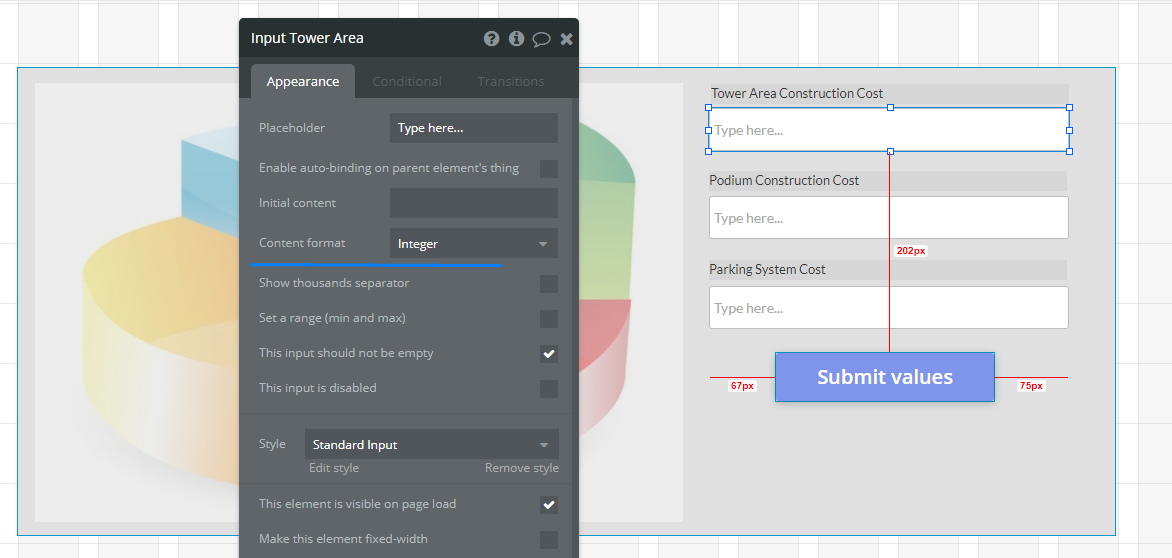
These fields are generated by the user input using the multiplication formula of (Area x Rate)

I just want to Create Siple Pie Chart from these values. I tried many options but it’s not been successful.

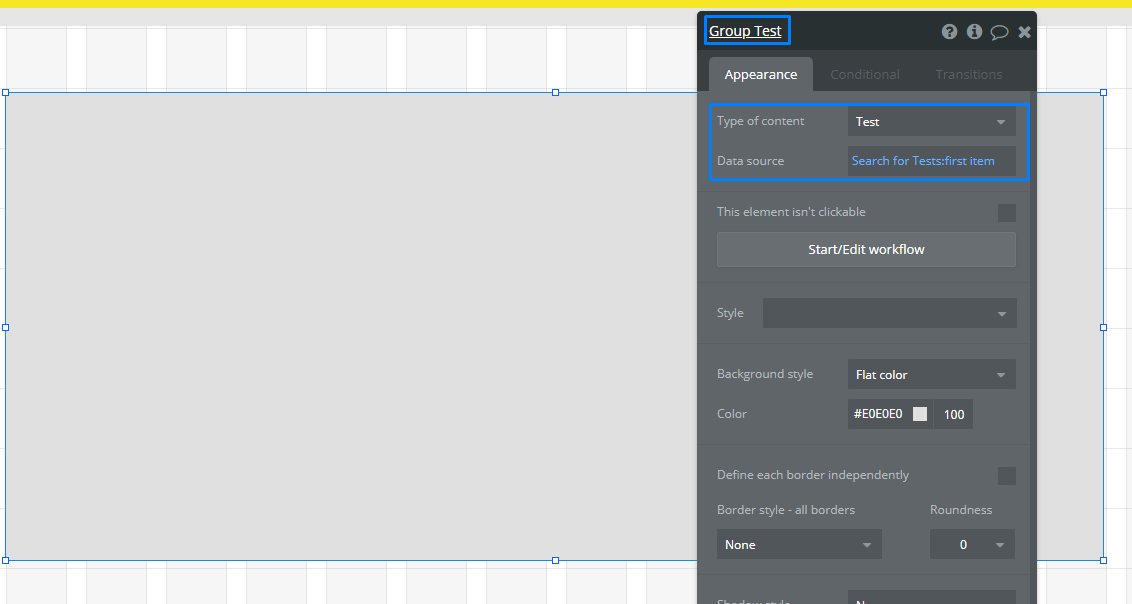
Attempt - 1 ) I have selected “do a Serch for” in my thing called “Expenses” where these columns are located. without giving any constraints
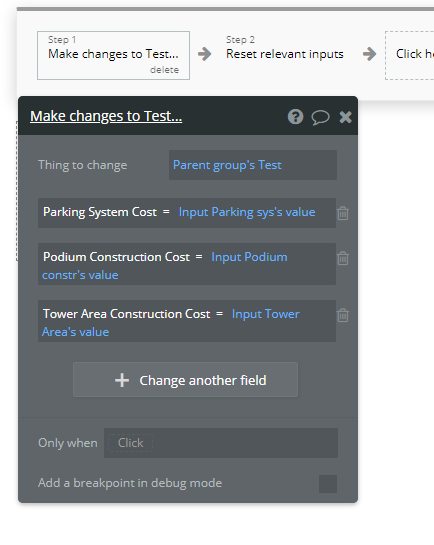
Attempt - 2 ) In the second exploration, I tried giving constraints of all columns in “do a Serch for” in my thing called “Expenses” but still of no use. Image attached for reference.
But the Result is like Below :

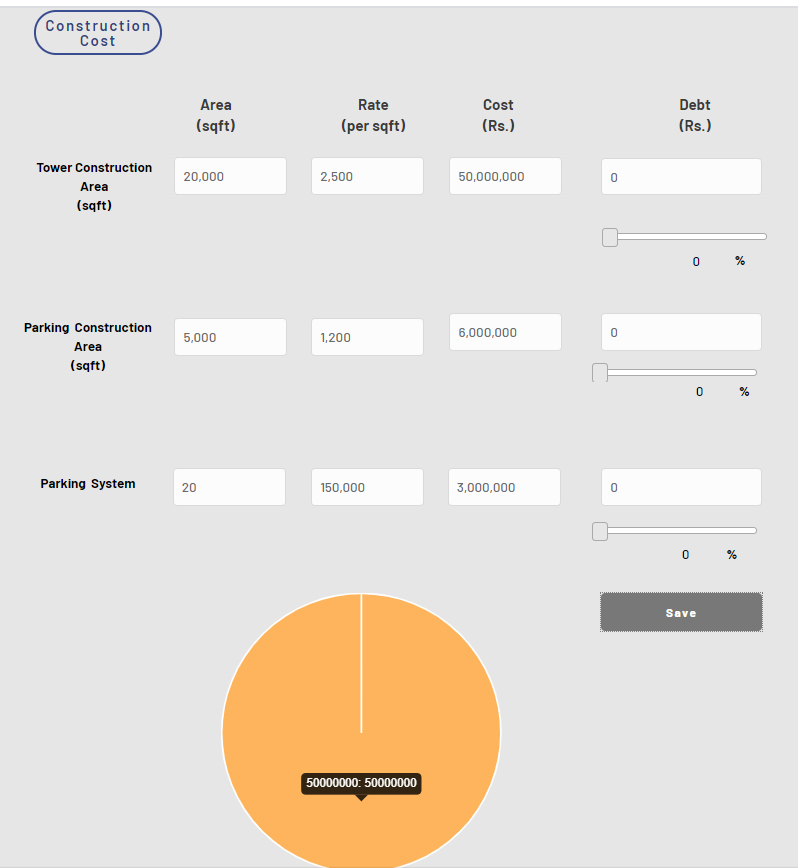
I just need to extract those three values from Database & Generate Pie Chart out of it.

All the values are Numeric and not the Text Field so I still don’t know how to create Tooltip & legend. Any Help on how to create Tooltip & legend will be very helpful.

Looking urgently for some Help. !!

Thanks in advance.

  • Aditya Chandra

Hello, @adityacc06. Thanks for reaching out.

I suppose, your main aim was to set the Pie Chart to display the data from the database table, to which the user’s input is being saved. If it is so, please take a look at my test materials:

  1. Created a group, set the group’s Type of Content = Expenses (in my case - it’s a Test table), Data source = Search for Expenses: first item:

  2. Placed a Google Charts element into this group, in the Properties field add the names of your table columns, in the Values (only numbers) add the dynamic values (with the comma separator) that correspond to the Expenses database records:


  3. Added 3 input fields for each Test table columns (Content format = integer !):

  4. Added the “Submit” button that saves the user’s input to the Test table, the Make changes to s thing action:


Now, each time the user submits his values, they will be saved to the Test database table and automatically displayed on the Pie Chart:
https://www.loom.com/share/fbb7d9d555324017b5f17846a72b34ef

I hope this will be useful for you :pray:
Please let me know if I can assist you somehow more.

Regards, Kate

Hi @kate
Thanks a lot for your Help. I was actually stuck with this Pie Chart for quite some time. This is indeed very helpful.
Just one quick question, I found that this Google Chart Plugin is paid. Is there any plugin which is free for making Pie Charts. Do you think, I can use Bubble.io Chart Plugin for my case which is free.

  • Aditya

@adityacc06,

You are always welcome :slightly_smiling_face:

Unfortunately, we do not have any free Chart plugins. But you can take a look at Quick Charts, Chart Element, Chart or amCharts plugins - they are free but you need to figure out how to use them on your own because there’s no demo page or documentation on them:

I hope it helps :pray:
Regards, Kate